Analysis of simulated data
Xavier Didelot
2026-01-21
Source:vignettes/simulation.Rmd
simulation.RmdSimulation
We start by generating a dated tree with no structure and a small effective population size year relative to the sampling frame of 10 years between 2010 and 2020:
library(DiagnoDating,quietly=T)
set.seed(1)
dates=runif(100,2010,2020)
dt=simcoaltree(dates,alpha=1)
plot(dt,show.tip.label = F)
axisPhylo(backward = F)
Next we generate a phylogenetic tree using an additive clock model (ARC) with parameters 10 and 5:

A root-to-tip regression analysis works quite well:
res=roottotip(tree,dates)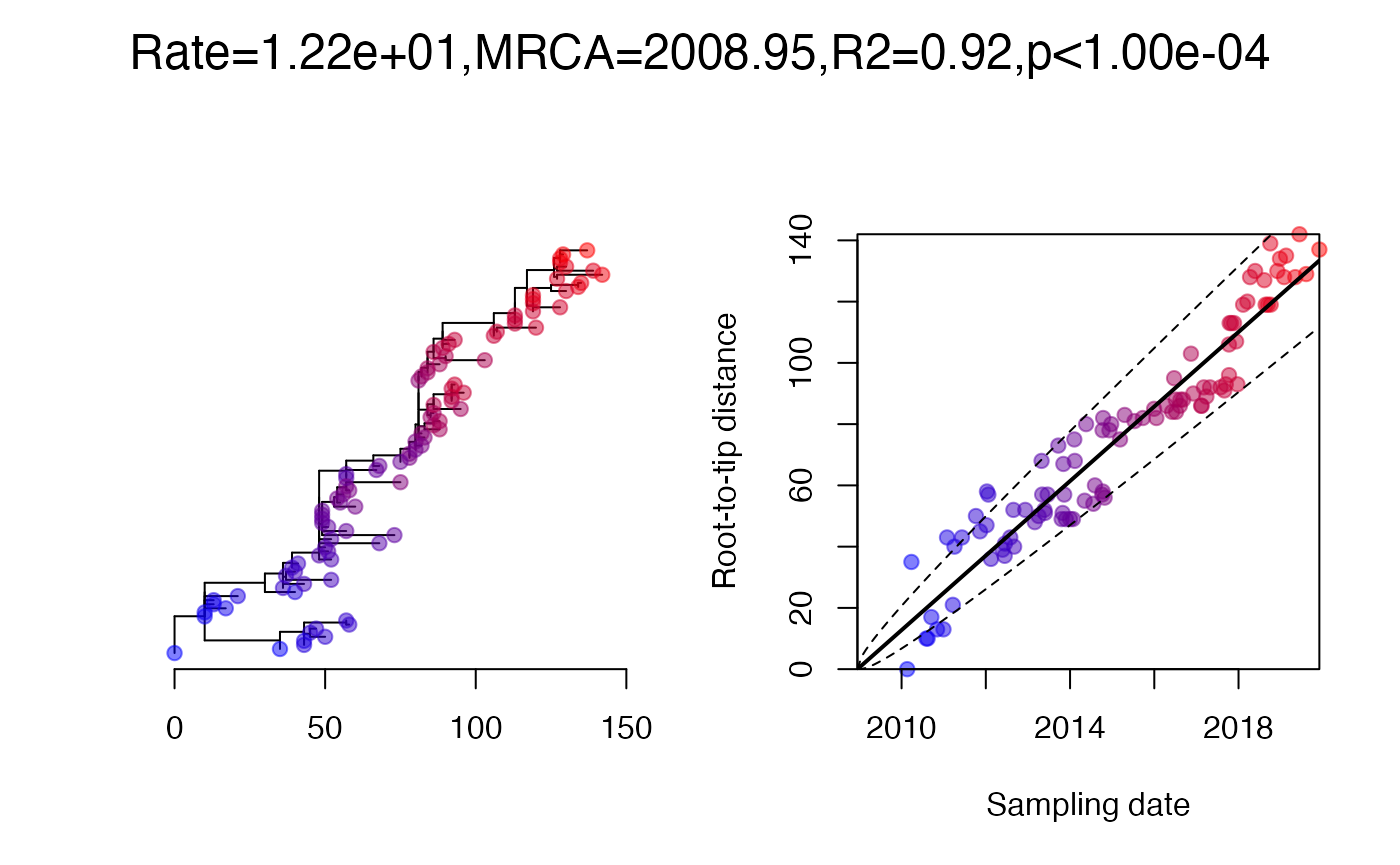
Analysis using incorrect model
Let us first run an analysis using an incorrect Poisson clock model instead of the correct ARC model.
## Result from BactDating, model poisson, clock rate 10.61, relaxation parameter 0.00, root date 2008.69We can see that there are issues using a posterior predictive check:
ppcheck(r,showPlot = T,showProgress = F)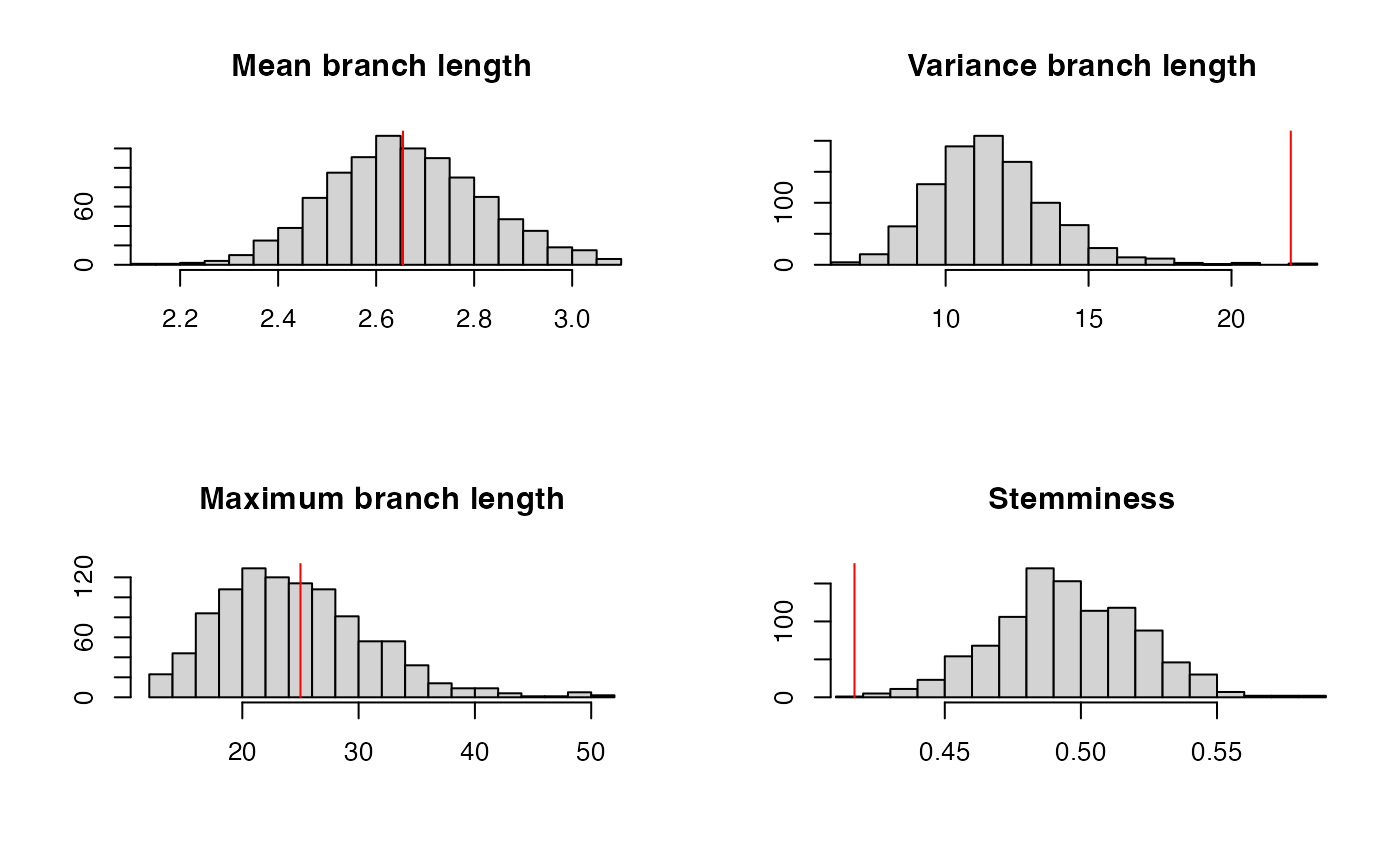
## [1] 0.004We can also see the issues when performing a residual analysis:
ps=postdistpvals(r,showPlot = T)
## The posterior distribution of p-values has median 0.00 and 100.00% of values below 5%Analysis using correct model
Let us now perform dating under the correct ARC clock model:
## Result from BactDating, model arc, clock rate 11.40, relaxation parameter 6.34, root date 2008.81The posterior predictive check is satisfied:
ppcheck(r,showPlot = T,showProgress = F)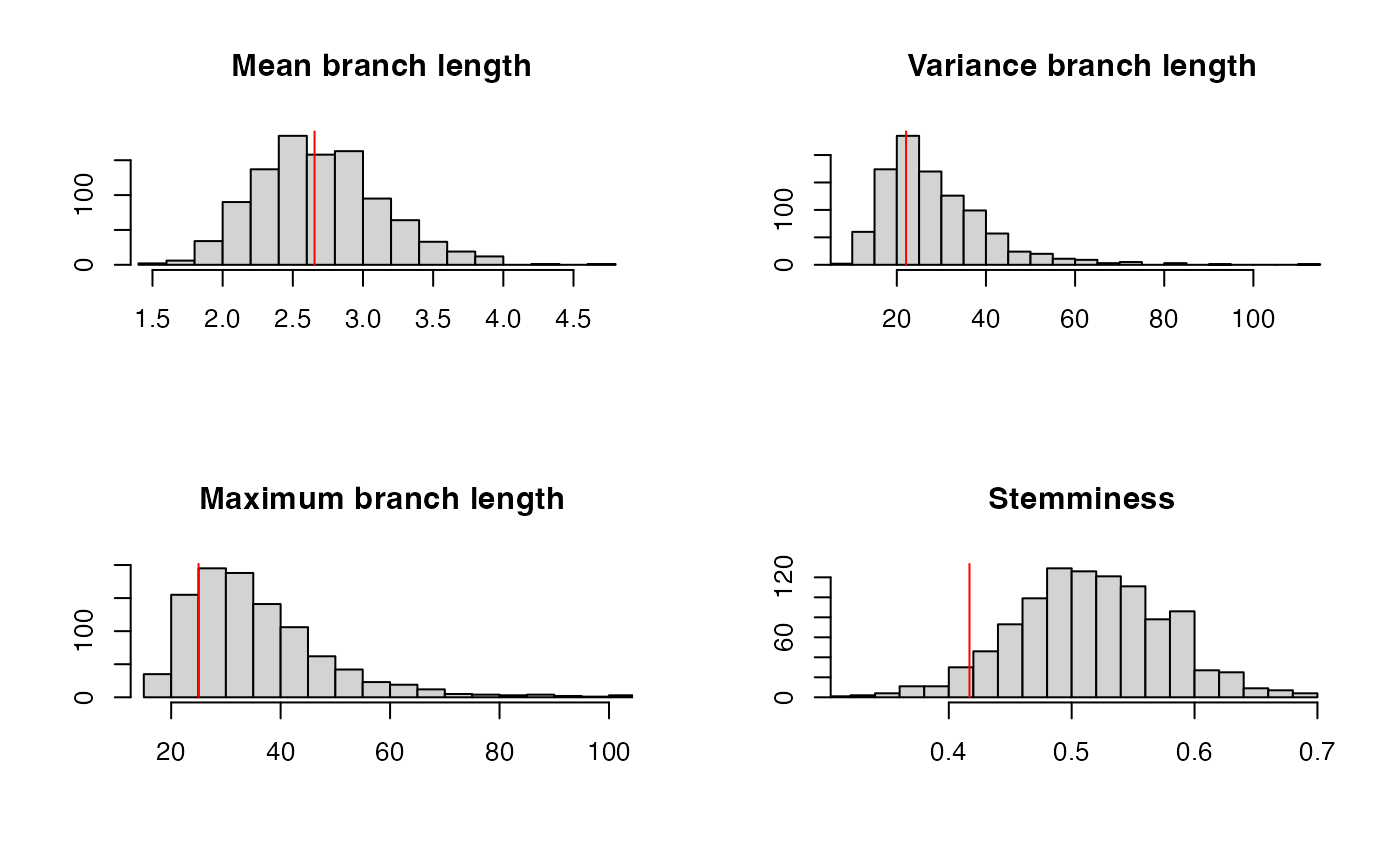
## [1] 0.2The residual analysis is also satisfied:
ps=postdistpvals(r,showPlot = T)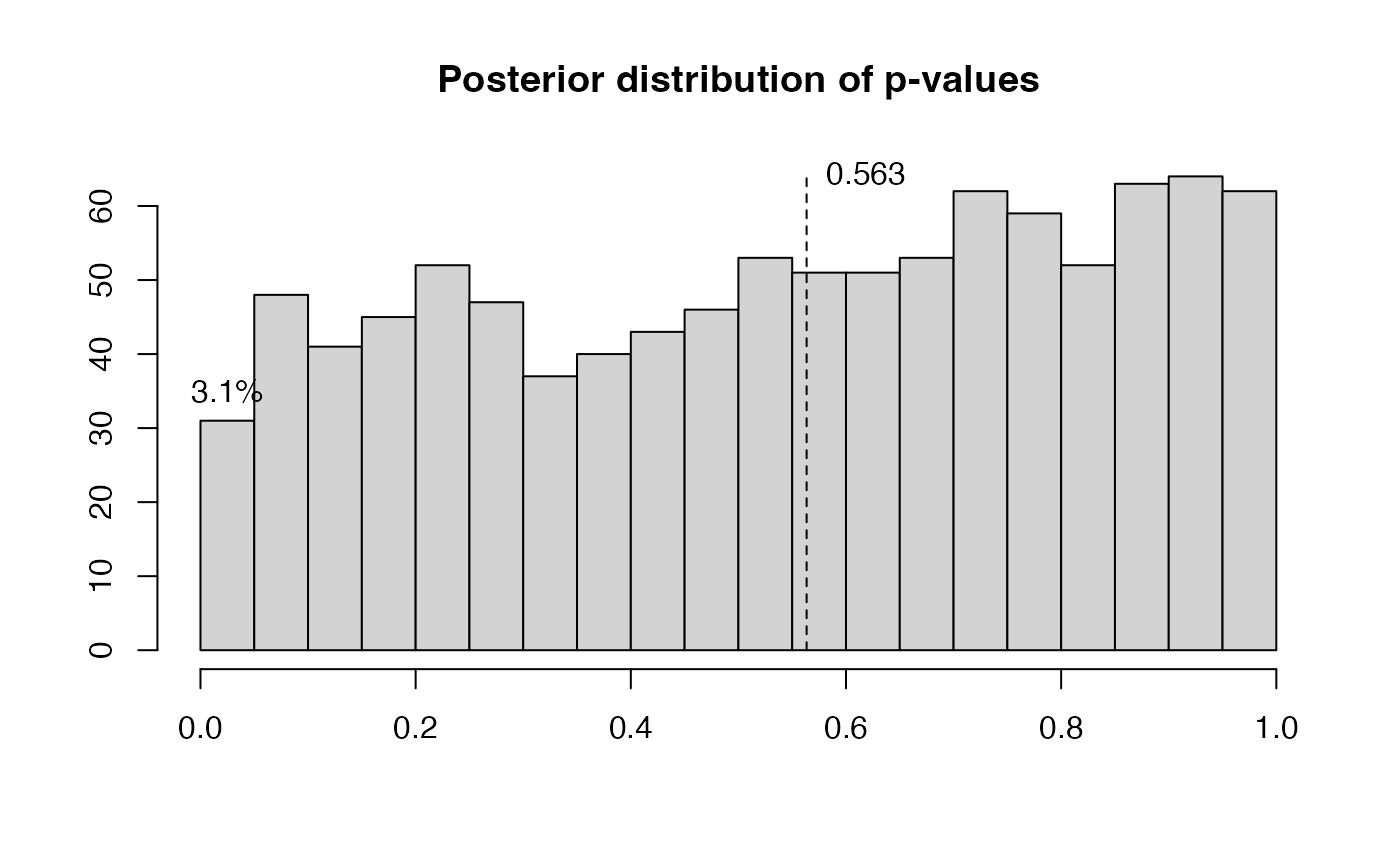
## The posterior distribution of p-values has median 0.56 and 3.10% of values below 5%