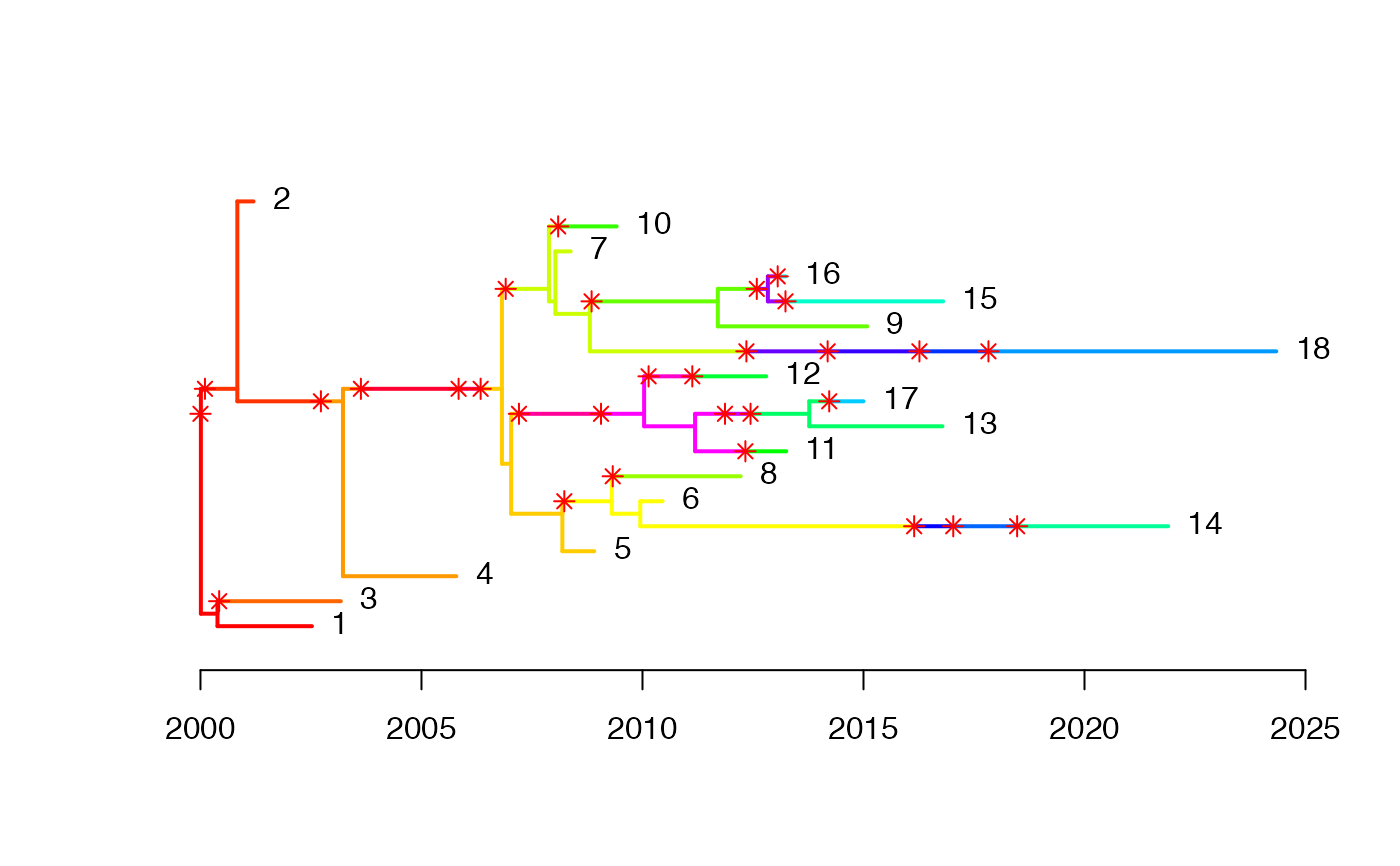
Plot both phylogenetic and transmission trees using colors on the phylogeny
plotCTree.RdPlot both phylogenetic and transmission trees using colors on the phylogeny
plotCTree(
  tree,
  showLabels = TRUE,
  showStars = TRUE,
  cols = NA,
  maxTime = NA,
  cex = 1
)
Arguments
- tree
Combined phylogenetic/transmission tree
- showLabels
Whether or not to show the labels
- showStars
Whether or not to show stars representing transmission events
- cols
Colors to use for hosts
- maxTime
Maximum time to show on the x axis
- cex
Expansion factor
Value
Returns invisibly the first parameter
Examples
plotCTree(simulateOutbreak())
#> Note that rejection sampling was used 1 times